Development of the East End
Before looking in depth at the boundaries of Wapping, I thought it would be interesting to consider how the East End of London and specifically Wapping has grown over time. I focus here on the 18th and 19th Century. I'm still looking for some good 20th century maps, so feel free to suggest some.
After having a look at the St George in the East website, which is a true treasure trove of information on Shadwell and Wapping (St George used to be the parish church for an area that extended broadly from Royal Mint, Wapping and Shadwell, and I will try and find some historic parish maps when considering boundary issues at a later date), I found a link to a wonderful resource, the East London History Society which has a good selection of historic maps through the late 18th and 19th century. I should also credit Sabiha Ahmad at the University of Michigan for digitising the 1889 Booth's Poverty map, which I have stitched together from a number of tiles.
The post is a bit long, but I think it offers a useful understanding of how Wapping has developed overtime. Blogsy, the app I used to include the photos appears to have deleted the hyperlinks to the high-res photos, but these can be found here or on the pages above.
1766 Merrick Map
Looking at the area in 1776, we can see that there was little in the way of development to the east of The City by the mid-to-late-18th century, certainly judging by the absence of roads, with only the area bounding the river showing showing any real density of roads, with the northern boundary of this area of development being Cable Street.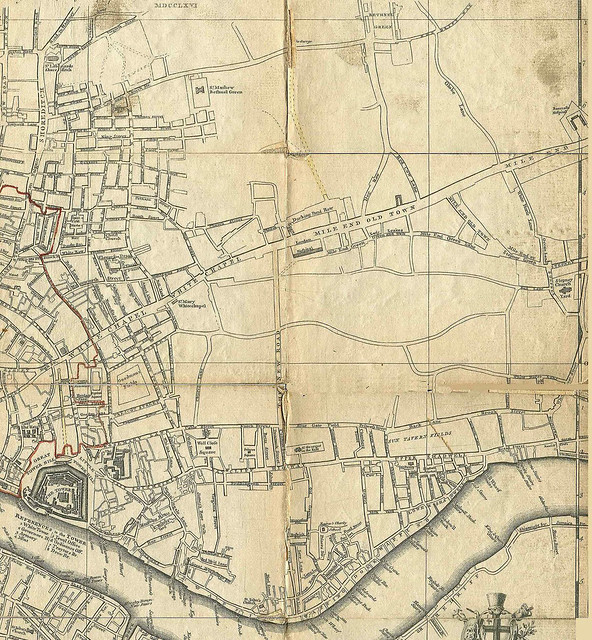 |
1776 Merrick Map
|
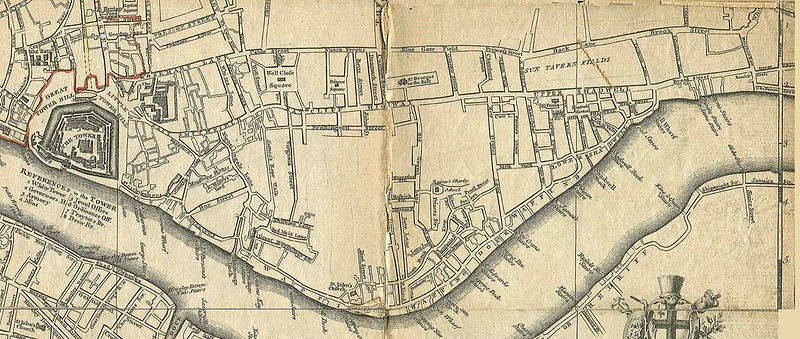
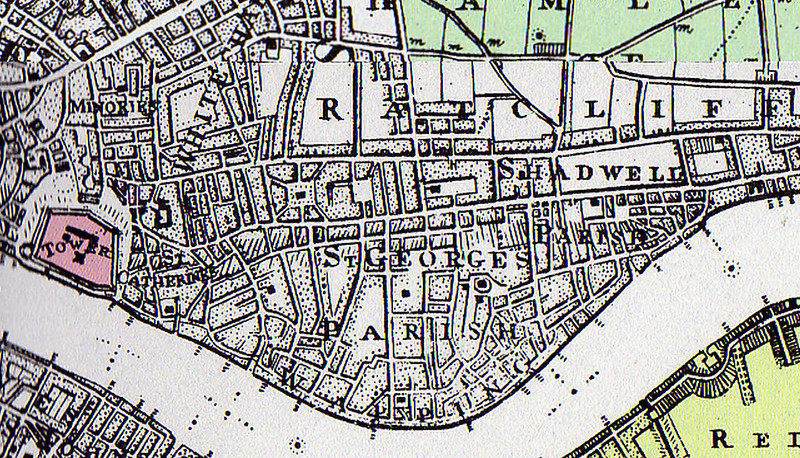
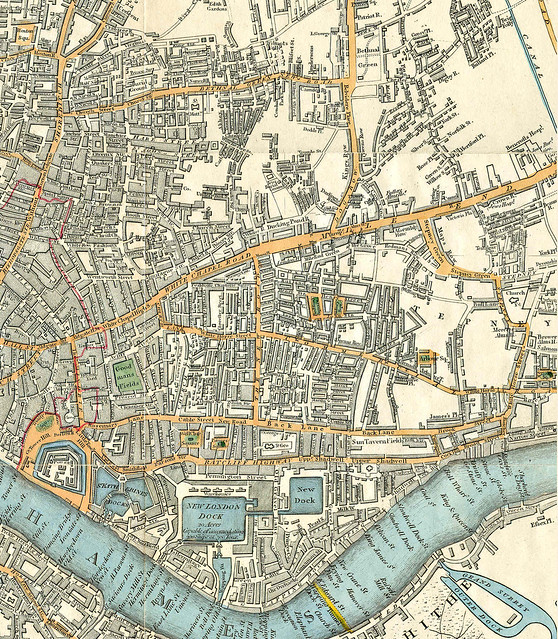
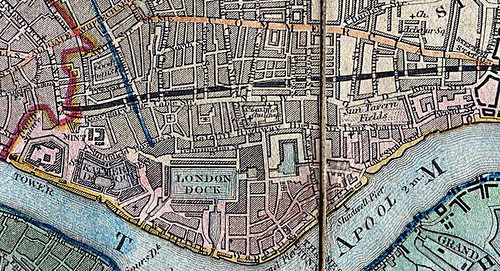
1769 Roque Map
There are a few maps on the Internet attributed to Roque. This one I think dates to 1769, so only a few years later, but displays the density of buildings better. I've stitched this together from two largish scale maps, hence the join in the middle.What this map really shows well is the fields in the centre of Wapping and which, as we'll see became the London Docks. The 'bad north' of Wapping, shows a degree of development spreading East from the city, and notably around Wellclose square, which is now the site of Shapla and St Paul's schools.
 |
1769 Roque Map
|
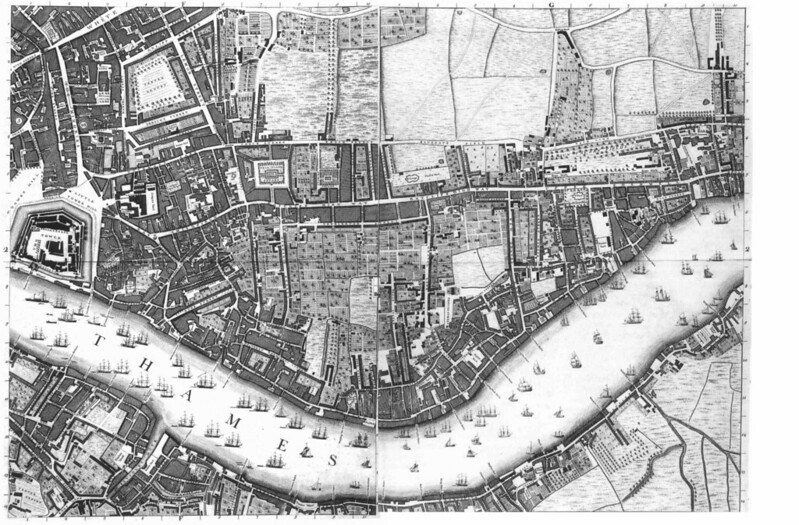
1800 Milne Map
In the following 30 years, the fields between Cable St and Aldgate High St/ Whitechapel Road begin to be developed, particularly north of Wellclose Square (below and to the left of the 'R' of Ratcliffe), and we begin to see buildings on the north side of Cable Street. However, the East End is still an area of open space. The Limehouse Cut canal is visible as the black diagonal line at the right hand side of the map just touching the 'E' of Limehouse.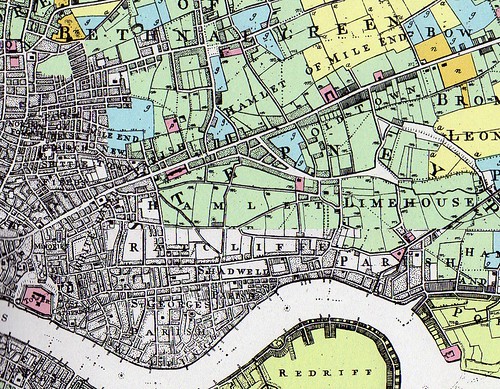 |
1800 Milne Map
|
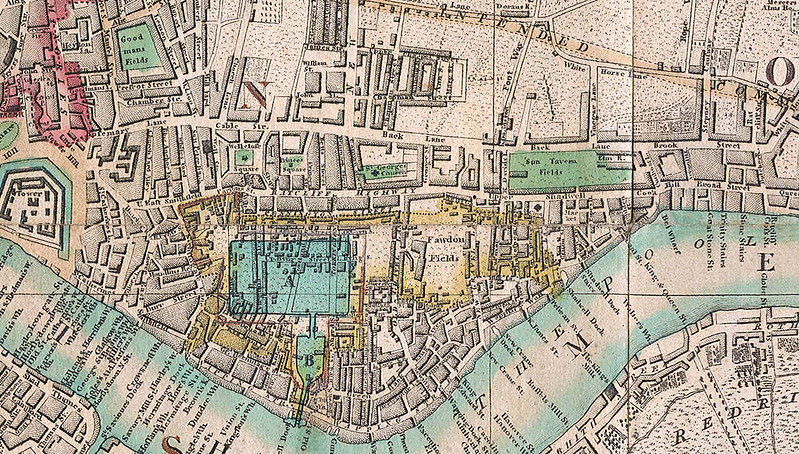
1802 Fairburn Map
Fairburn's map two years on shows a similar level of development as the previous map but with one very significant difference...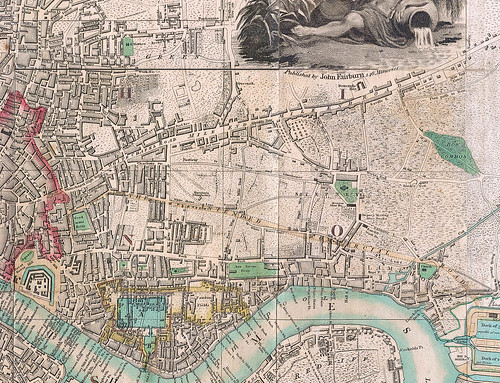 |
1802 Fairburn Map
|
Work began on the docks in about 1799, with the first dock opening in 1805 (according to Wikipedia) so it looks as though Fairburn decided to include some level of future proofing in his map!A subtle difference between this and the Milne map I find interesting is the inclusion of Fawdon Fields, which seem to have been blocked as development in the Milne map. The yellow outline around the fields demarks the ultimate extent of the future dock system, and looking north we see the intended course of Commercial Road, straightening out some of the bends in the existing road. At this point, one really understands the name of the Commercial Road, we're not talking about a road named for its shops, rather, a brand new road, in an almost straight line from The City to the docks on the Isle of Dogs.
1810 Laurie & Whittle Map
Less than ten years later, we can see that a large element of Wapping has actually been cleared, ready presumably for the expansion of the docks.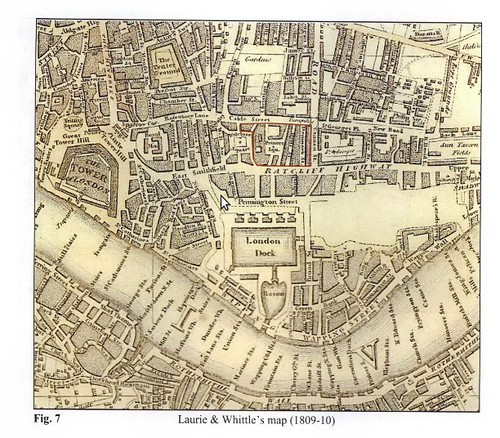 |
1810 Laurie & Whittle Map
|
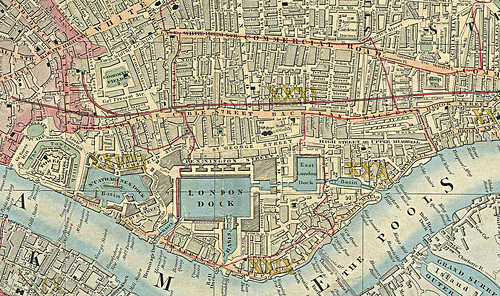
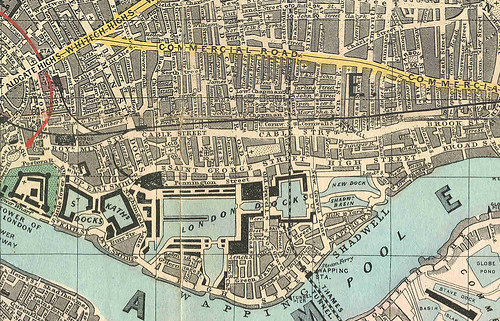
1822 Carey Map
Another decade and the Commercial road has been built, though not quite as straight as desired, and the space between it and Cable St is largely filled in. Indeed, solid development stretches up to Bethnal Green Road, although not quite filling the area bounded on the east by Cambridge Heath Road.Looking south, we can see Wapping has a 'New Dock' and the Tobacco warehouse has been built and St Katharine Dock makes an appearance for the first time. A yellow line at the bottom right shows the proposed Thames Tunnel (construction 1825-43).
 |
1822 Carey Map
|
1831 Cruchley Map
Progress slows over the next 9 years, though we can see the Regent Canal which was completed in 1820 (you can just see it in the top right corner of the previous map) and Limehouse Cut (completed 1777) on this map. Notice that at this point the Limehouse Cut doesn't meet Limehouse Basin (and didn't until the 1960s).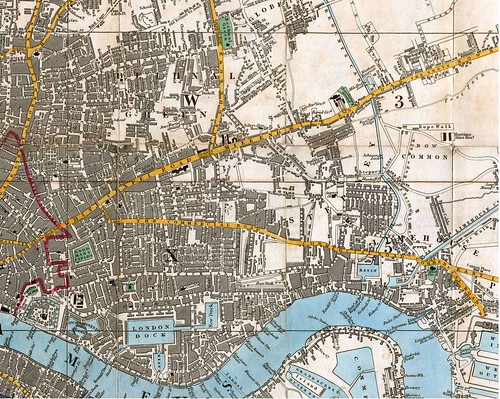 |
1831 Cruchley Map
|
1840 Davies Map
There are a number of significant developments in the 1840 map:- The black line at the top is the Eastern Counties Railway, which initially in 1839 terminated at Devonshire Street in Mile End, before being extended to Bishopsgate station in1840. (Devonshire Street is now part of Bancroft Street, with the station being near the corner with Globe Street (you can see the red square)).
- The lower black line is the new London and Blackwall Railway, terminating here at Minories, and which ultimately provided some of the viaduct for the DLR.
- The Shadwell entrance to the docks and the new basin which opened in 1832 are shown for the first time.
 |
1840 Davies Map
|
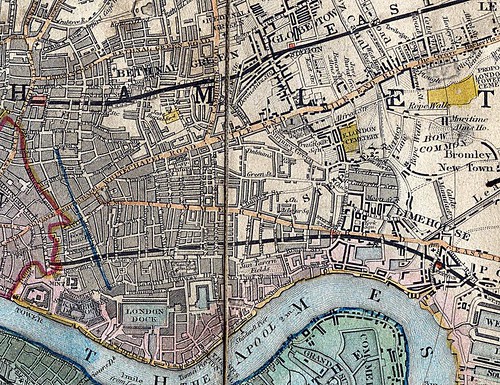
1844 Wyld Map
Only four years later we can see that eastward expansion continues in Stepney and Bethnal Green.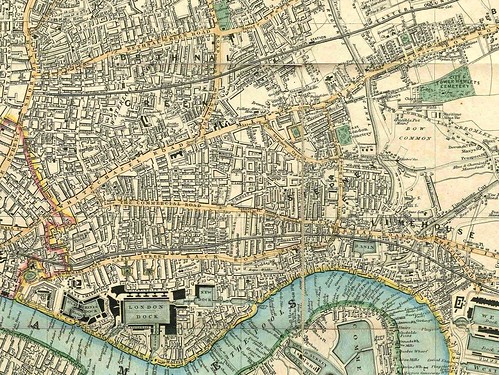 |
1844 Wyld Map
|
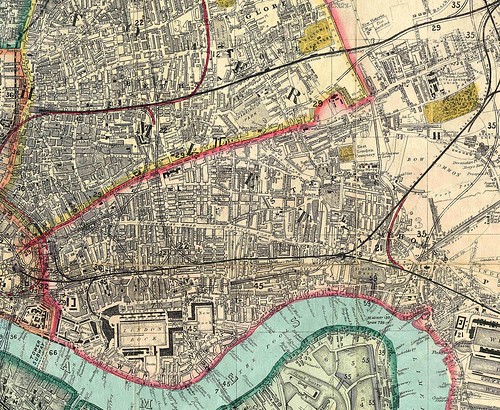
1853 Cross Map
By 1853 it appears that density of development in Wapping seems to have settled down. We can see however the London, Tilbury and Southend Railway branching off from the Blackwall Railway tracks at Limehouse.I need to do some more digging into what the red and blue lines signify on the map, I think they may be parish boundaries.
 |
1853 Cross Map
|
1864 Wyld Map
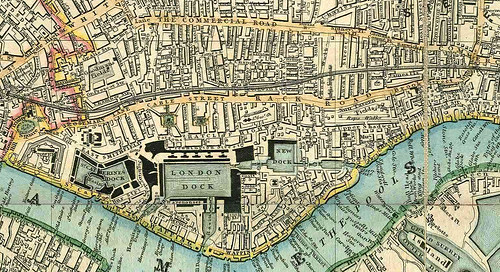
The 1864 Wyld Map's greatest interest is what appears to be the inclusion of a number of proposed railway lines and tunnels. It was in 1865 that the Thames Tunnel was acquired by the East London Railway, though a year earlier, there were clearly plans for its use, with what looks like a tunnel towards The City on a very straight and direct route, as well as a number of other linkages.One route that did get built was the spur of the Blackwall tunnel to the East Smithfield goods depot, visible on this map, curling around towards the docks, and which Charles Dickens Jnr noted meant that the London Docks and Victoria Docks were linked directly by rail.
For the first time we can see a central pontoon/pier marked in the western dock – I don't know if this was a new construction, or just that it's the first time it was documented.
 |
1864 Wyld Map
|
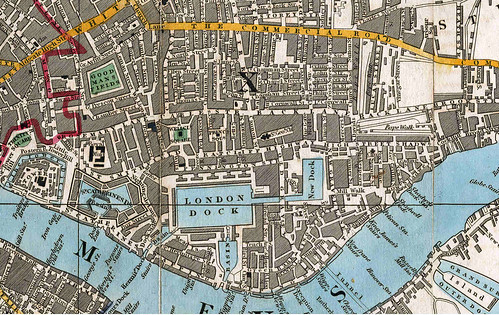
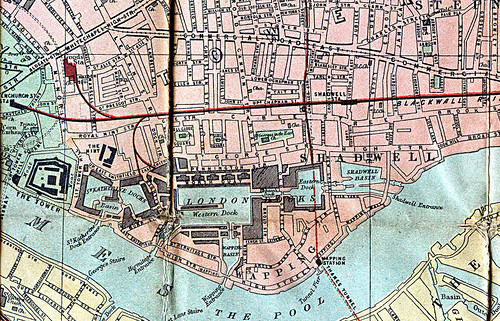
1875 WH Smith Map
By 1875 we can see the East London Railway marked on the map (having started operating in 1869) running to Shoreditch (and going underneath the Eastern Dock).We can also see the expansion of Shadwell Basin that took place in the 1850s (which Wyld appears to have missed completely!), with the building of a new entrance and an expanded basin.
 |
1875 WH Smith Map
|
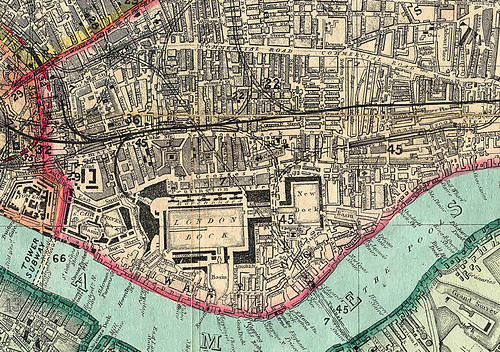
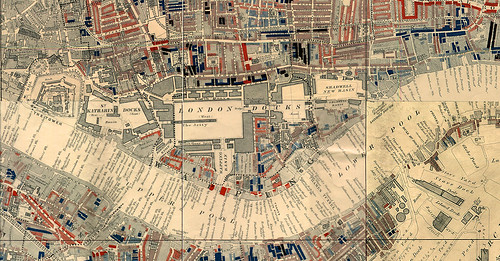
1882 Reynolds Map
The 1882 map, clearly shows the two separate elements of the eastern end of the dock system. Not much more development is evident, though the map does nicely show some familiar road names. |
1882 Reynolds Map
|
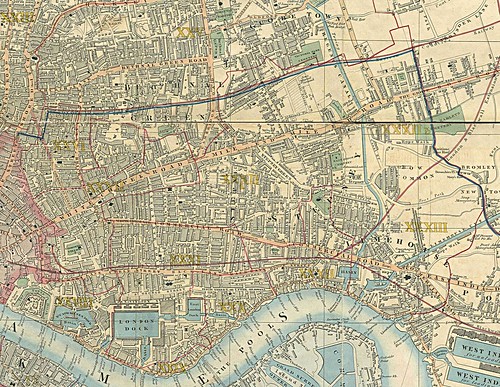
1889 Booth Poverty Map
In the 1889 Booth map, the continuing development of the Shadwell end continues, with there appearing to be a unification of the two dock areas, rather than the old and the new in previous maps.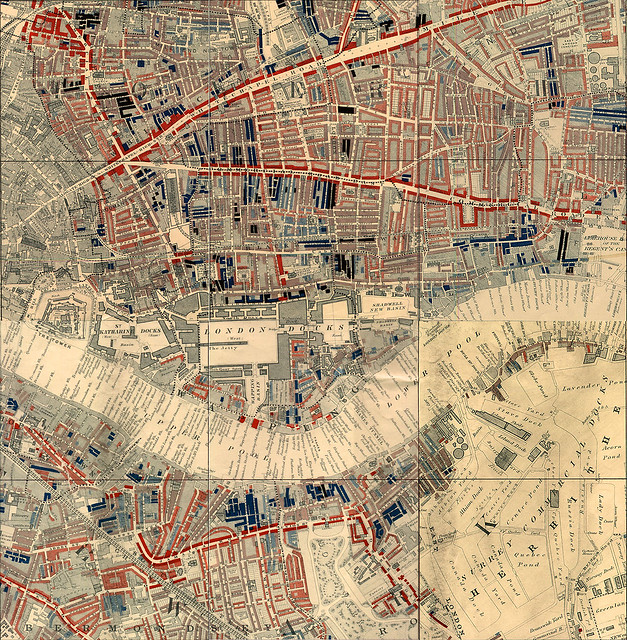 |
1889 Booth Poverty Map
|
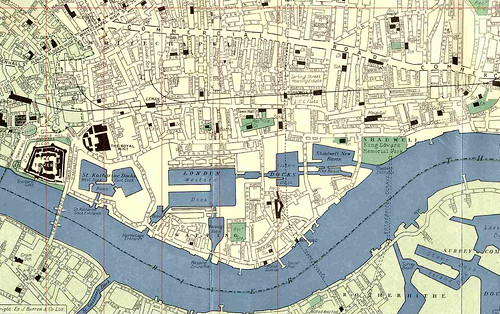
1952 Borough Map
A big jump in time, but not very much change, with Shadwell basin in its final state, although we can see two connecting canals, rather than the one ornamental canal we now have. The King Edward Memorial Park has been established as has Glamis Road.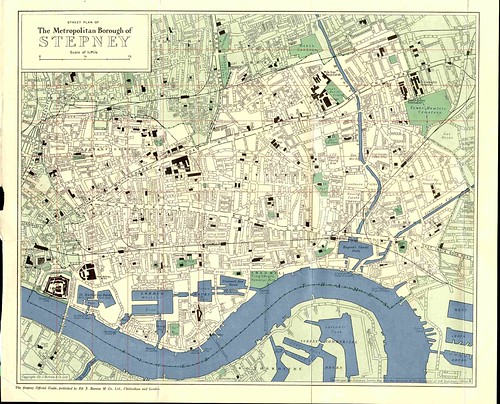 |
1952 Borough Map
|
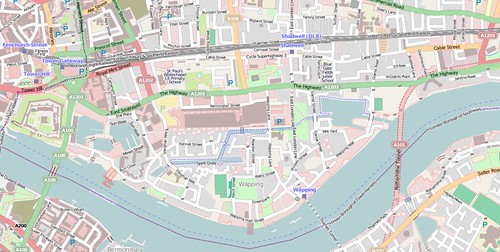
2012 Open source Map


Comments
Post a Comment
Please leave a comment to let me know if you think I've got it totally or partially wrong!